Analysis of the new datasets
import xarray as xr
import xarray.ufuncs as xrf
import numpy as np
import matplotlib.pyplot as plt
import pandas as pd
import glob
from matplotlib import colors

from definitions import *  # imports all functions from definitions.py

xr.set_options(
    keep_attrs=True, display_style="html"
)  # Attributes of DataArrays will be kept through operations.
plt.rcParams["font.size"] = "22"


alt = [
    70,
    72,
    74,
    76,
    78,
    80,
    82,
    84,
    86,
    88,
    90,
    92,
    94,
    96,
    98,
    100,
    102,
    104,
    106,
    108,
    110,
    112,
    114,
    116,
    118,
    120,
]
root_path = "/home/gemeinsam_tmp/UA_students/data/PW_GW_analysis/"
#dir_path = "/home/hochatmstud/bene/"


def sea_SES_special(days_period, station_name, var):
    df_dates = pd.read_csv(
        dir_path
        + "dates/without_final_warmings/ssw_dates_without_final_warmings_SES_all_dates.csv"
    )  # you can load SSWs from a csv file like attached
    dates = df_dates.set_index("BeginDate")

    xa_ls = []
    max_lag = days_period
    for il, days in enumerate(range(-max_lag, max_lag + 1)):
        sel_dates = pd.to_datetime(dates.index) + pd.Timedelta(str(days) + " days")
        mask = np.in1d(var.time.dt.floor("1D"), sel_dates)
        comp_m = var.sel(time=mask).mean("time")
        comp_s = var.sel(time=mask).std("time")
        comp_m.name = f"{var.name}_mean"  # Variable Mittelwert umbenennen
        comp_s.name = f"{var.name}_std"  # Variable Standardabweichung umbenennen
        comp_m.attrs["units"] = var.attrs["units"]

        xa_ls.append(
            xr.merge([comp_m, comp_s])
        )  # Merge arrays of mean and standard deviation in one data array

    xa_comp = xr.concat(xa_ls, dim="days")
    xa_comp["days"] = range(-max_lag, max_lag + 1)

    return xa_comp
station = "Leipzig"
# Parameters
station = "Sodankyla_Kiruna"
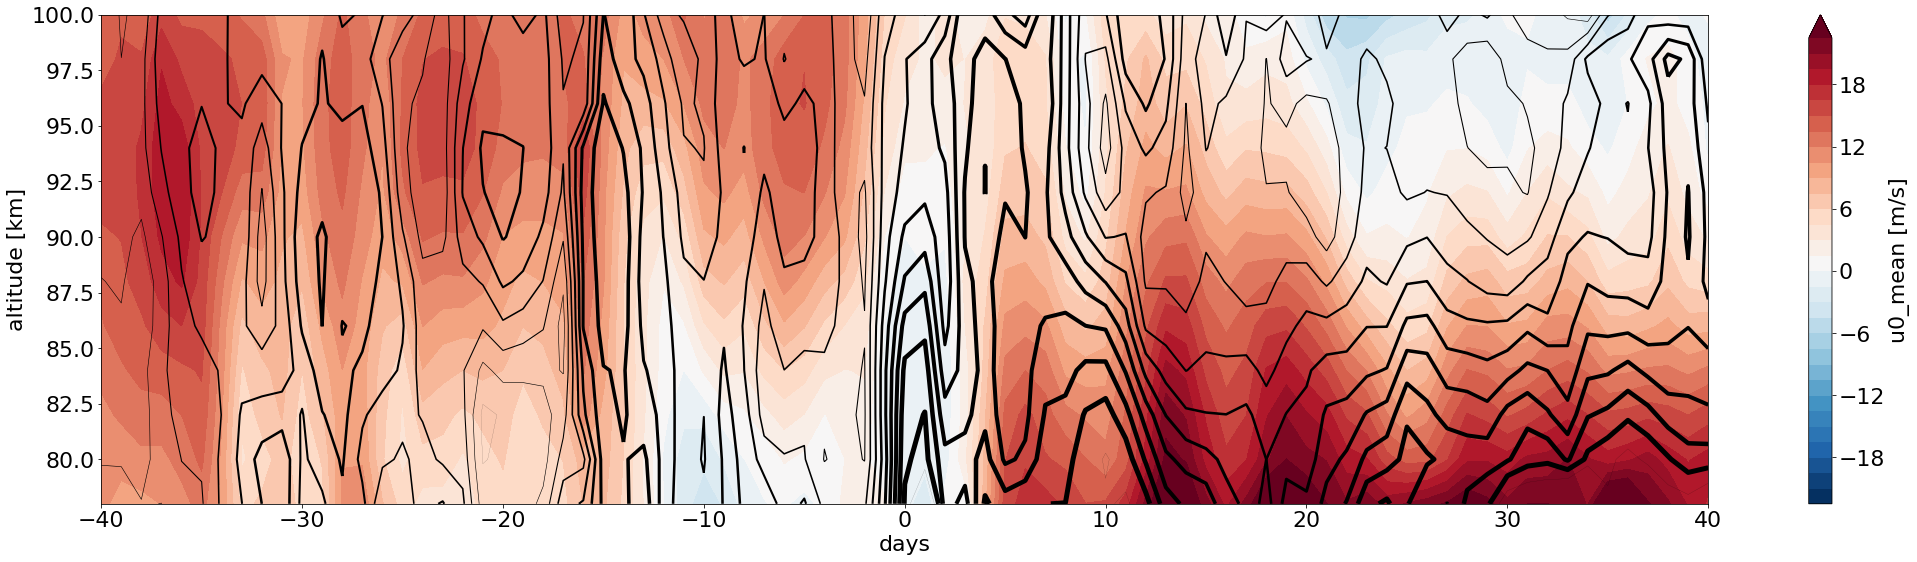
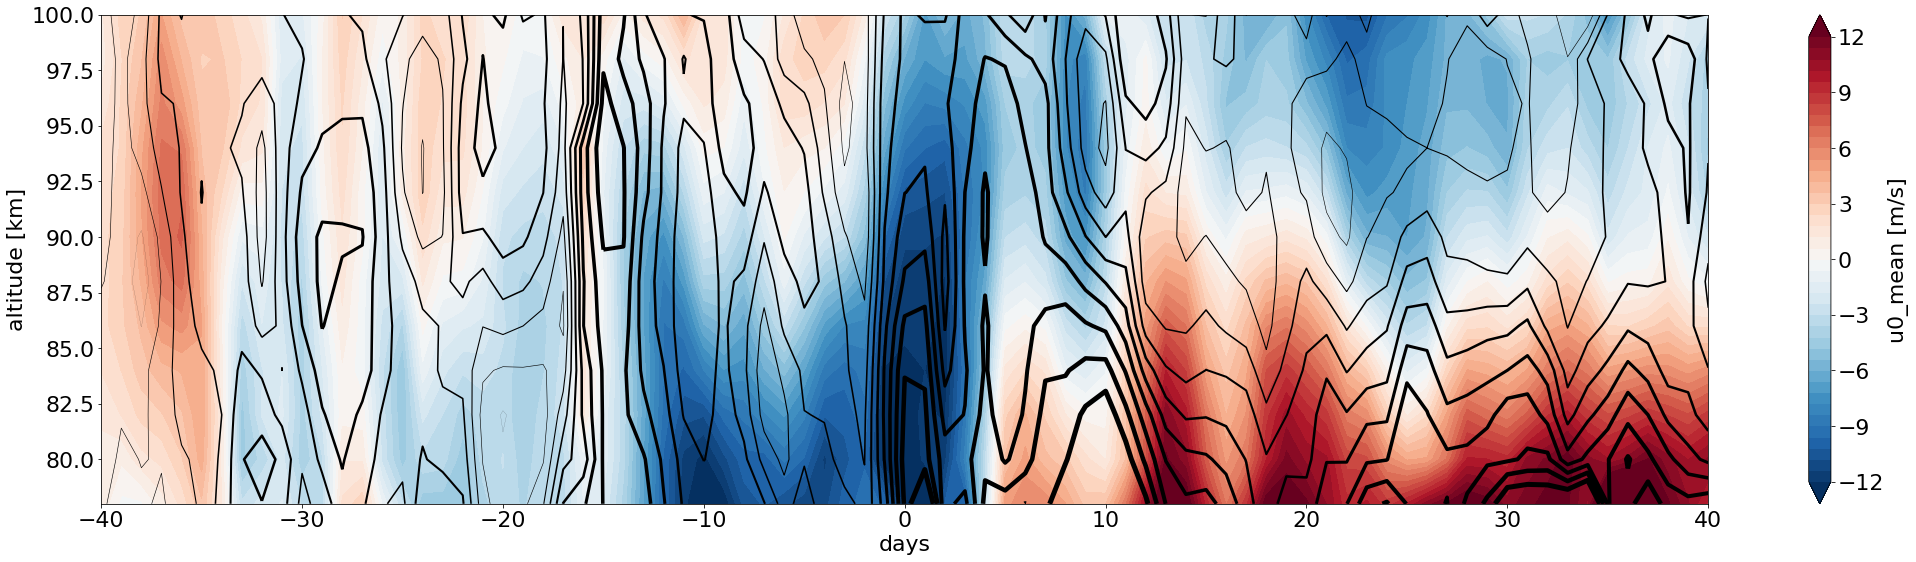
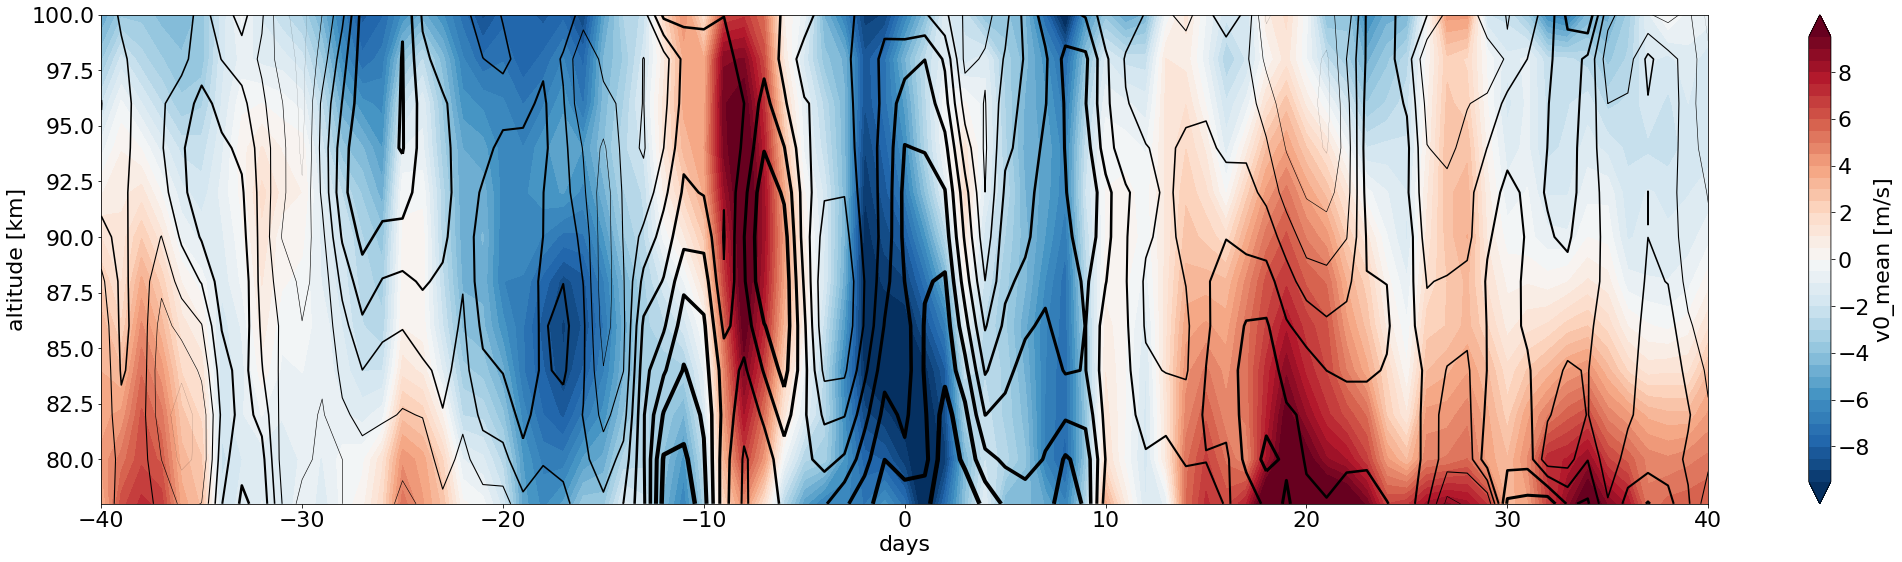
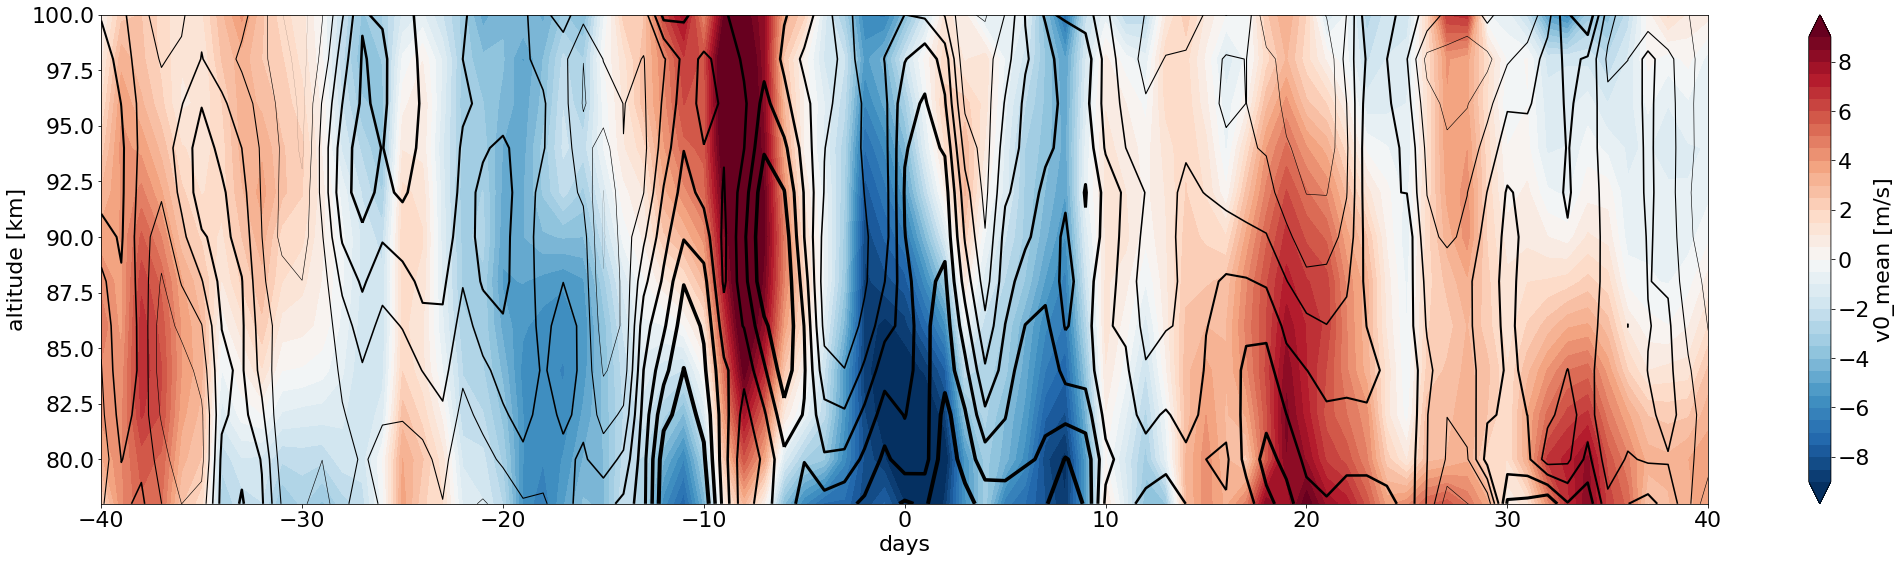
Wind measurements
ds_wind = read_group("wind", station, root_path)

u = read_var(ds_wind, "u0")
v = read_var(ds_wind, "v0")

u_anomalie = anomalie("dayofyear", u)

v_anomalie = anomalie("dayofyear", v)

sea_u = sea_SES_special(40, station, u)
sea_u_anomalie = sea_SES_special(40, station, u_anomalie)

sea_v = sea_SES_special(40, station, v)
sea_v_anomalie = sea_SES_special(40, station, v_anomalie)
Wave estimates
ds_waves = read_group("waves", station, root_path)
gw = read_var(ds_waves, "GW")
pw = read_var(ds_waves, "PW")

gw_anomalie = anomalie("dayofyear", gw)

pw_anomalie = anomalie("dayofyear", pw)

sea_gw = sea_SES_special(40, station, gw)
# sea_gw.name = 'sea_gw'
sea_gw_anomalie = sea_SES_special(40, station, gw_anomalie)
sea_gw_anomalie["name"] = "sea_gw_anomalie"

sea_pw = sea_SES_special(40, station, pw)
# sea_pw.name = 'sea_pw'
sea_pw_anomalie = sea_SES_special(40, station, pw_anomalie)
sea_pw_anomalie["name"] = "sea_pw_anomalie"
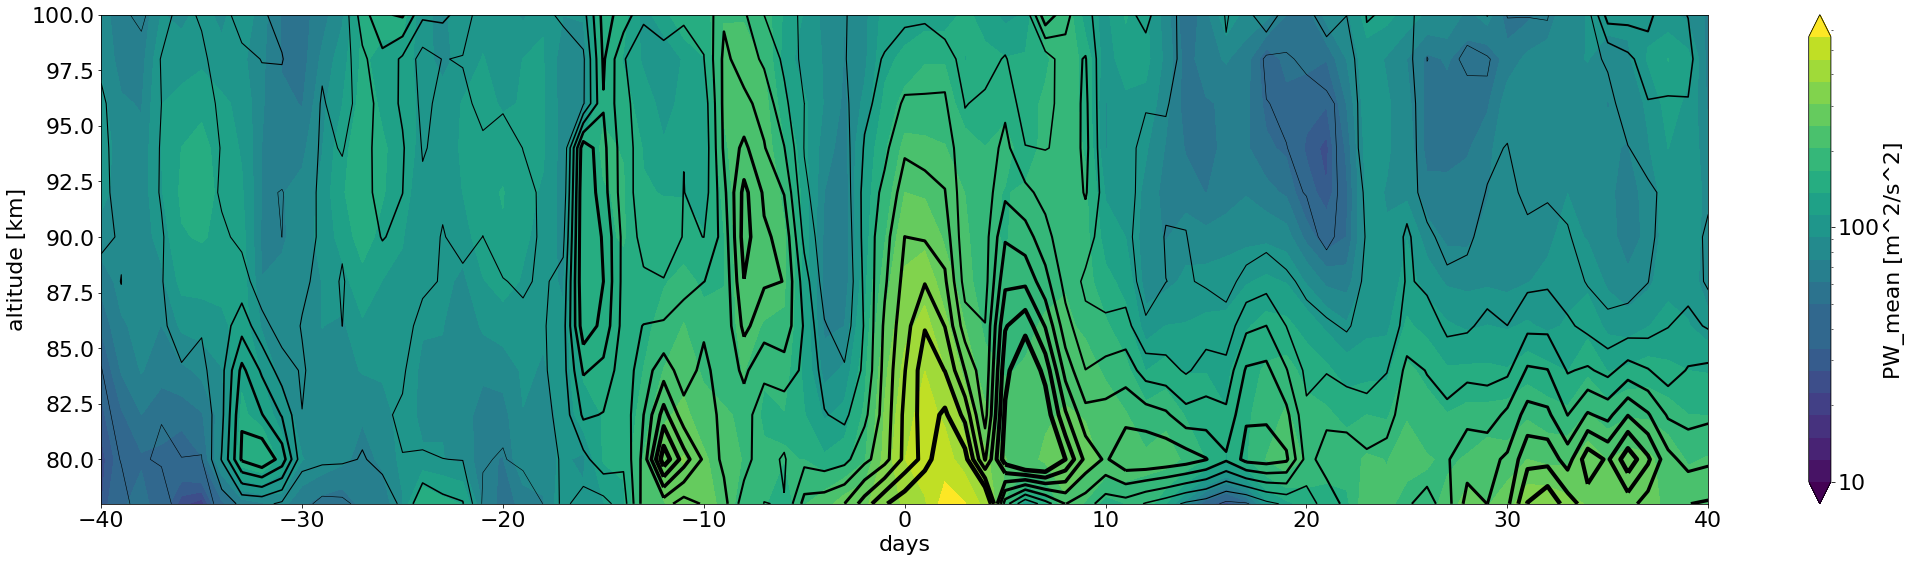
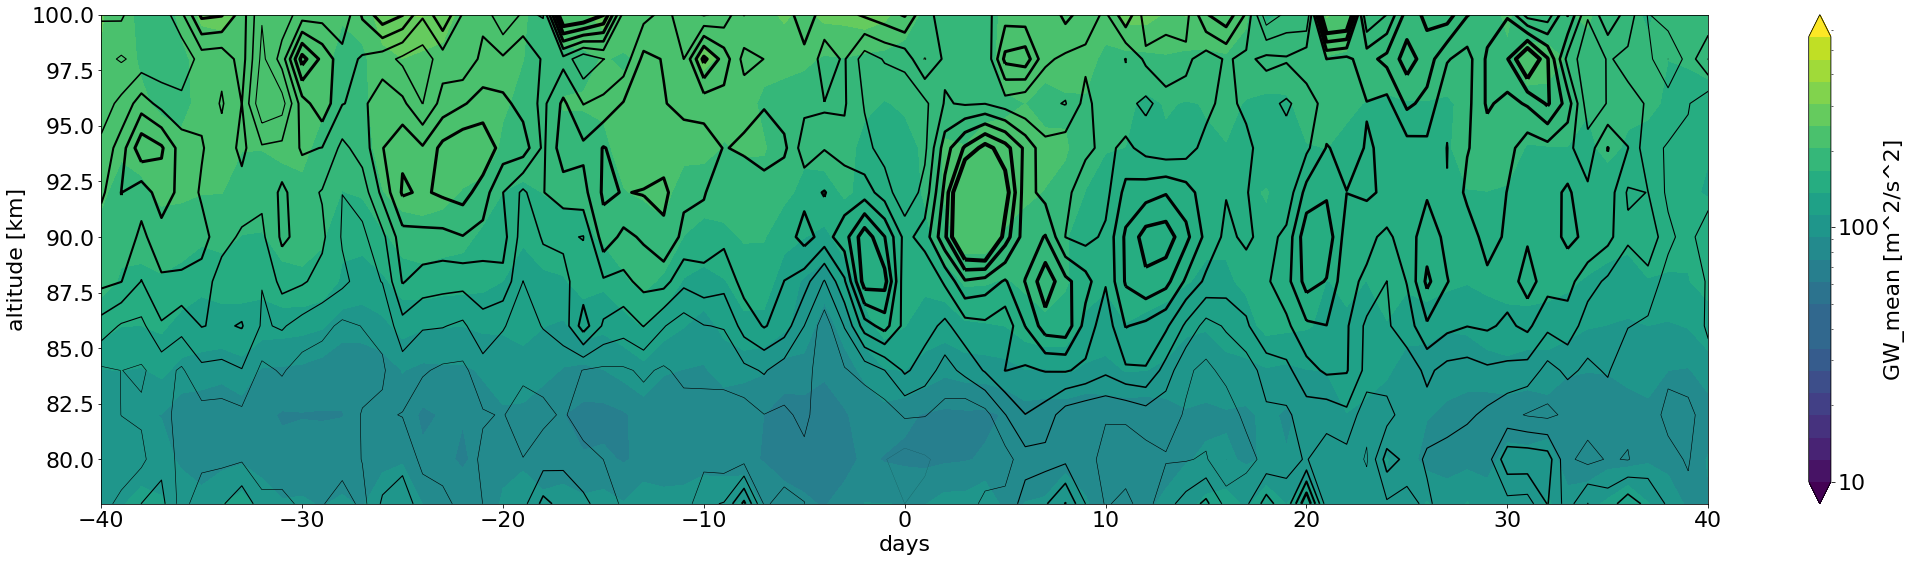
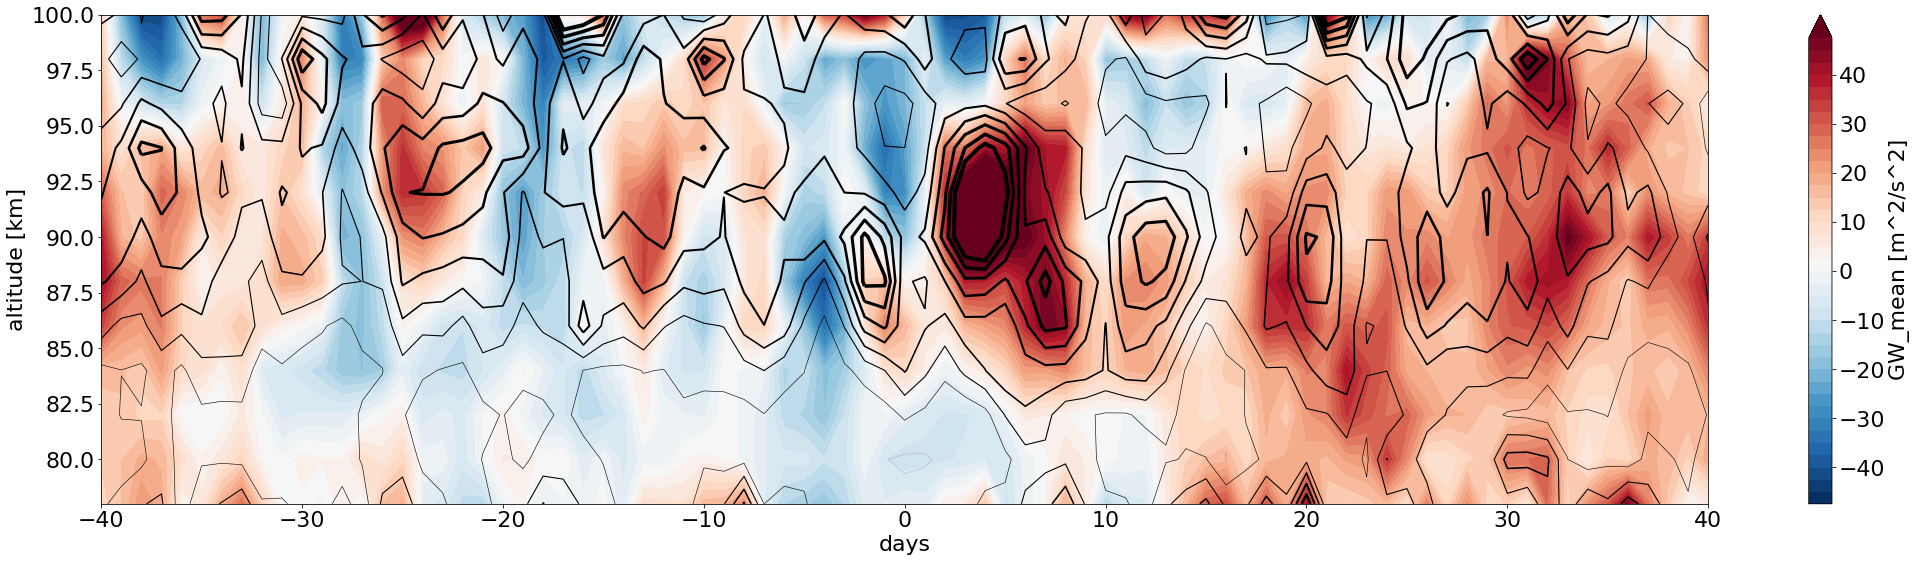
Gravity waves
Gravity wave activity
Climatology
plotting_routine(sea_gw, "GW", True)
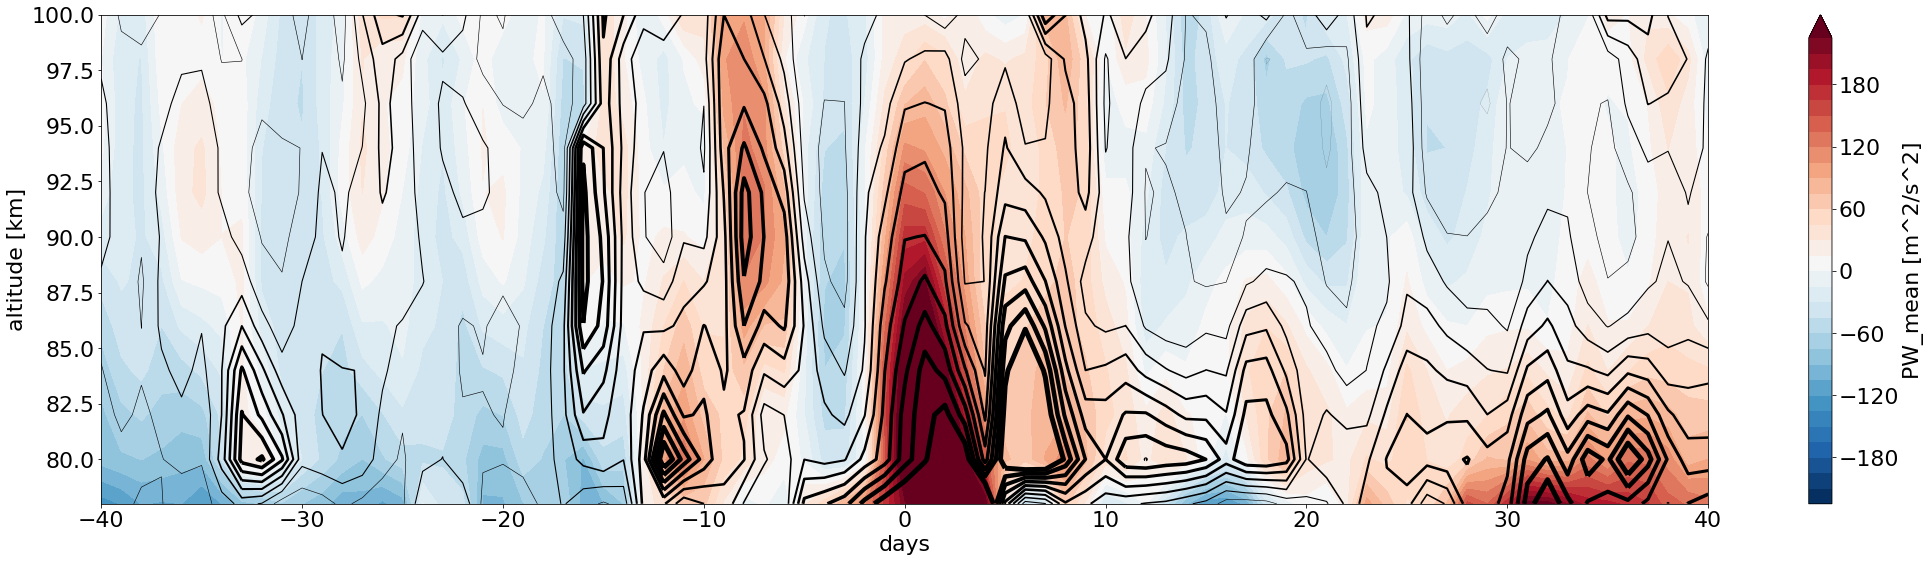
Anomalies
plotting_routine(sea_gw_anomalie, "GW")
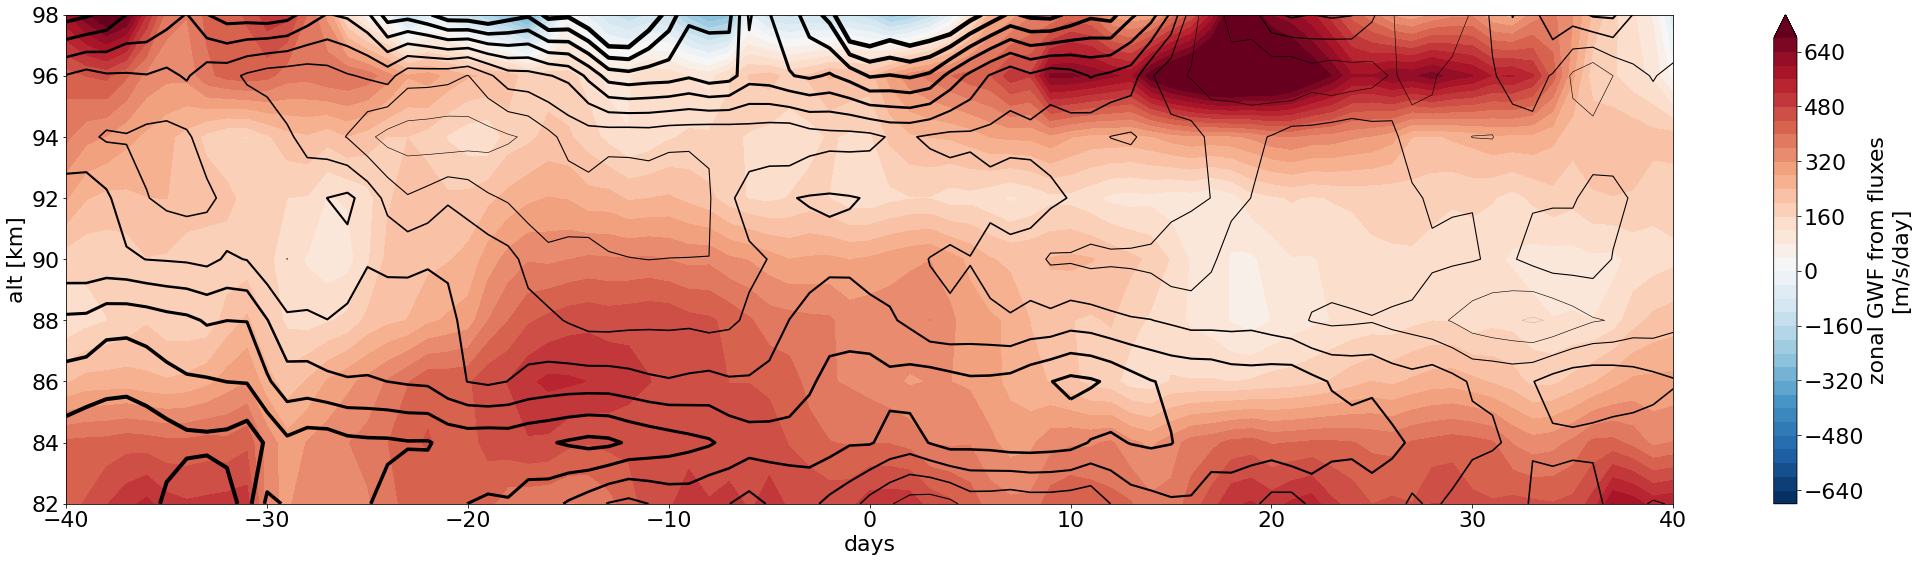
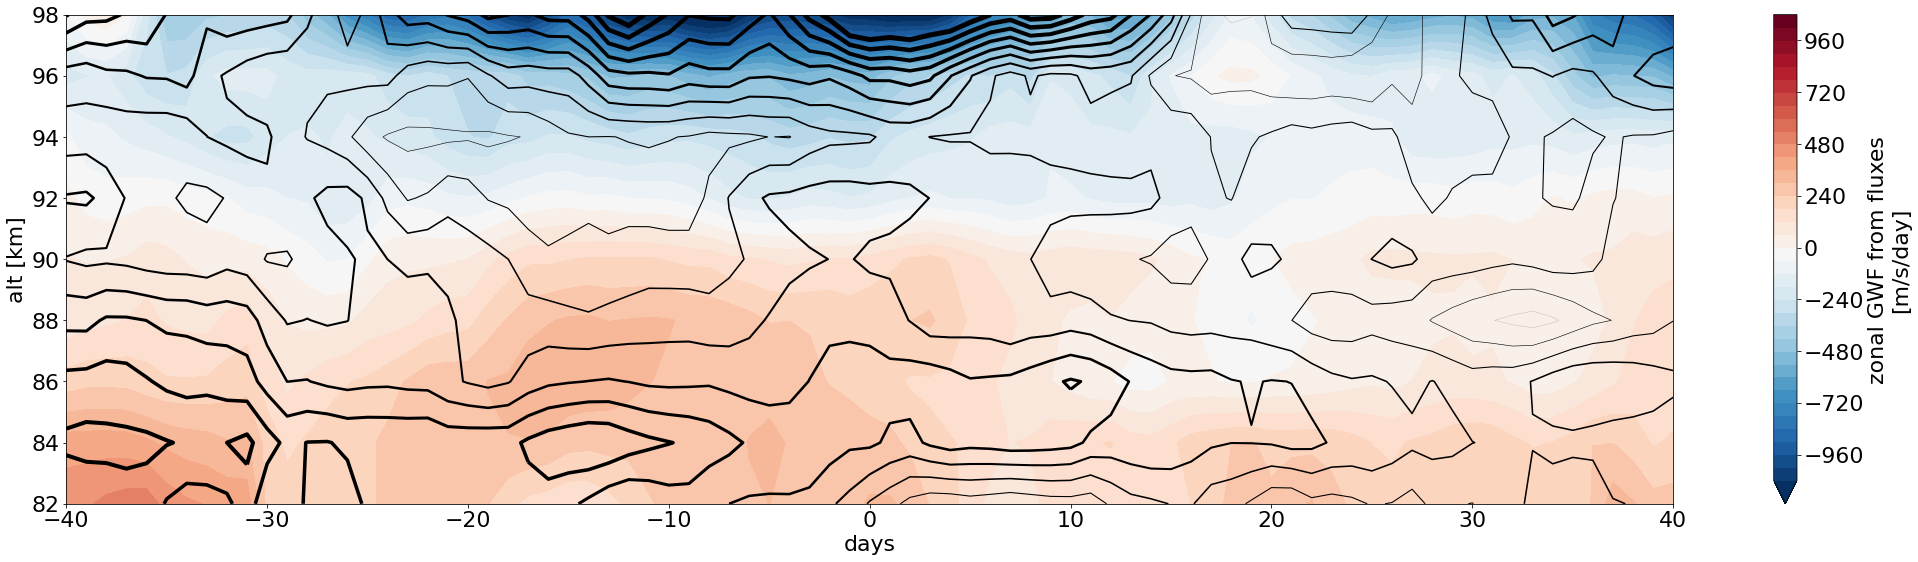
Gravity wave drag
station_name = station

directory = glob.glob(f"{root_path}GWD*_{station}.nc")[0]

# directory = root_path + 'GWD_1999-08-01_2021-05-01_Sodankya_Esrange.nc'

ds = xr.open_dataset(directory)


gwd = ds["GWD"]

gwd_anomalie = anomalie("dayofyear", gwd)

sea_gwd = sea_SES_special(40, station_name, gwd)
# sea_gwd.name = 'sea_gwd'
sea_gwd_anomalie = sea_SES_special(40, station_name, gwd_anomalie)
Climatology
plotting_routine(sea_gwd, "GWD")
Anomalies
plotting_routine(sea_gwd_anomalie, "GWD")